Technology can help people make better decisions. Our powerful design thinking tools enable our teams to gain insight and quickly iterate on potential solutions to optimize design outcomes and performance.
Data & Design Tools
Informed design is better design. Our team, comprised of designers, planners, data scientists, and software developers, uses data and technology to ask smarter questions and reveal deeper insights. This specialist team works at the intersection of research & development, analysis, innovation, and professional practice to empower strategic design. Our offerings include: Design Thinking Tools, Community Engagement, What-if Modeling, and Data Visualization and Storytelling.

We connect with stakeholders through many means, and intuitive digital engagement tools are fast-becoming one of the most powerful ways to uncover new insights and reach broader audiences.
Supporting more informed dialogue around potential planning and design directions, we create detailed views into future scenarios through modeling building performance, growth projection, spatial planning implications, financial and scheduling trade-offs, and more.
To facilitate better understanding of data and insights among diverse stakeholders, we create intuitive data visualizations and story-telling platforms that are interactive and easy to understand
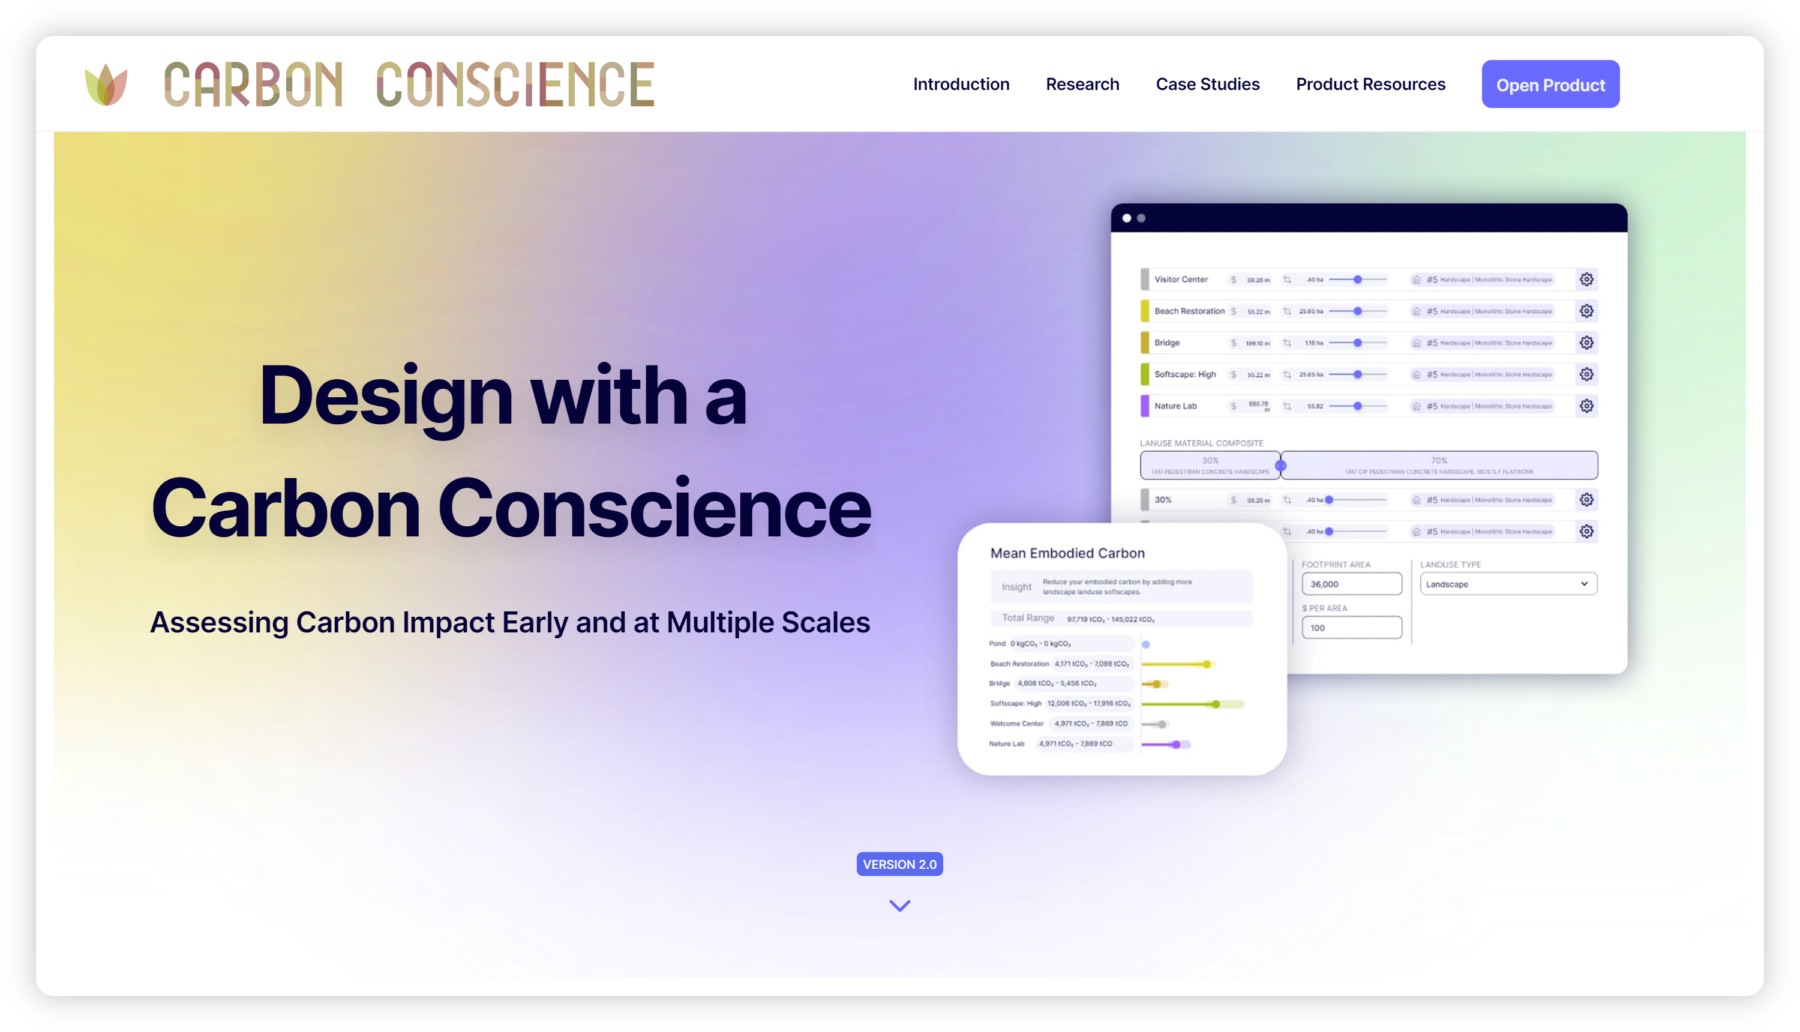
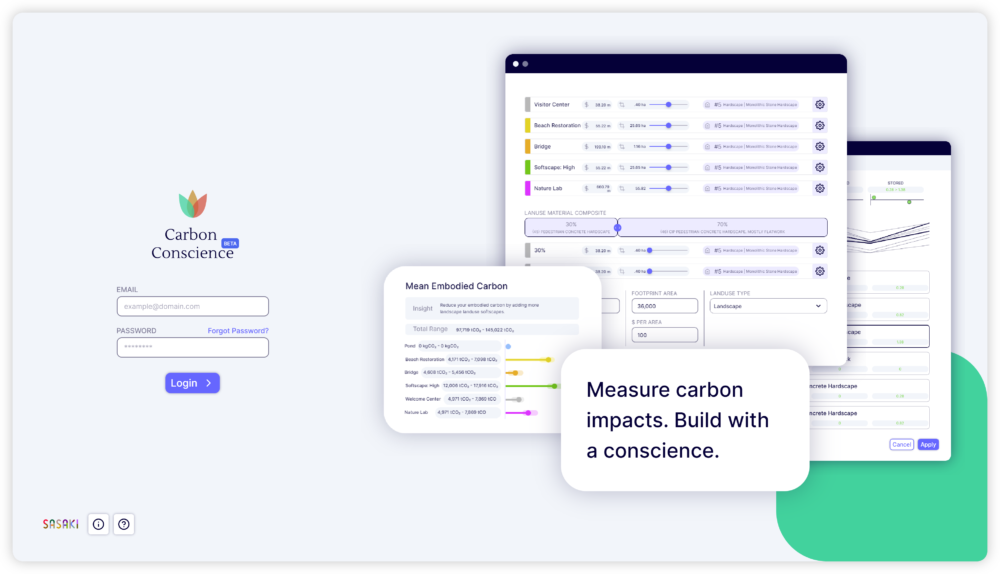
Sasaki's new tool allows users to estimate embodied carbon during crucial early design stages
Sasaki's custom DASHI tool gives the University of Colorado Boulder flexibility to adjust to the campus’s ever-changing needs
Sasaki landscape architect Chris Hardy imagines a future where designers and planners can bring carbon sensitive design to every project

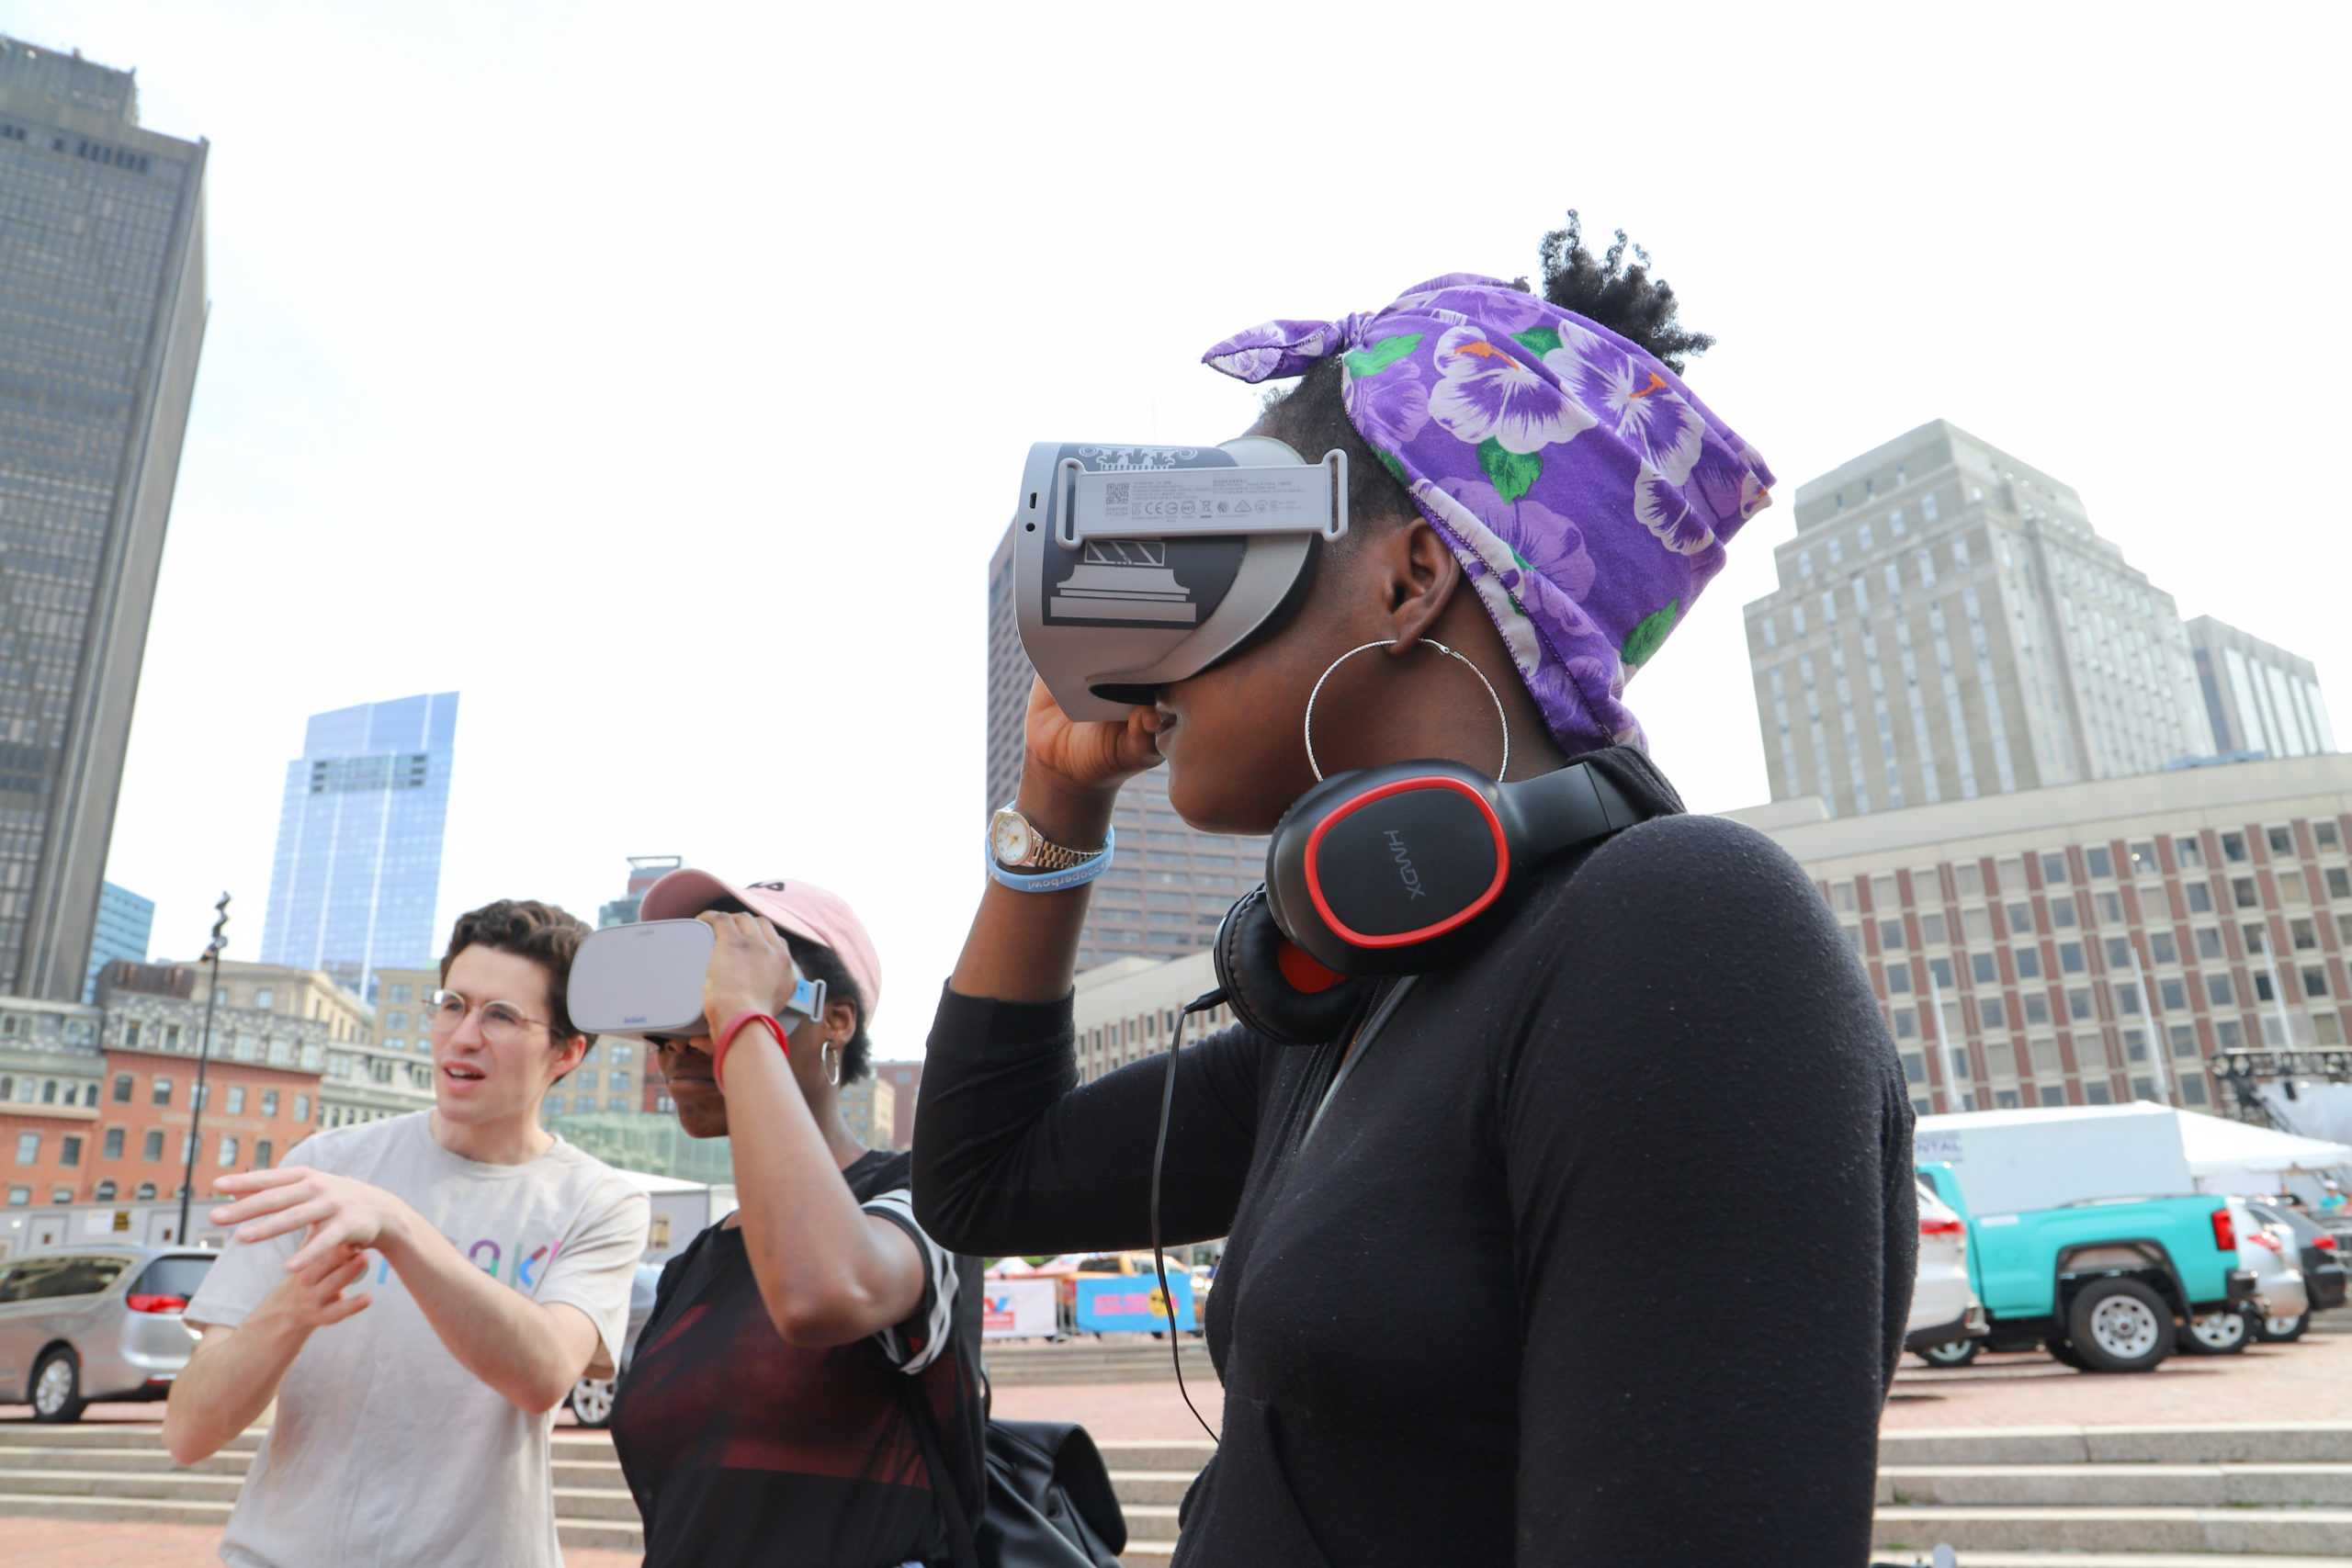
Virtual Reality offers Boston an interactive vision of the new Boston City Hall Plaza, gives clients insight into new arts and dining facilities
Planning and design for the future of affordable healthcare in Mexico
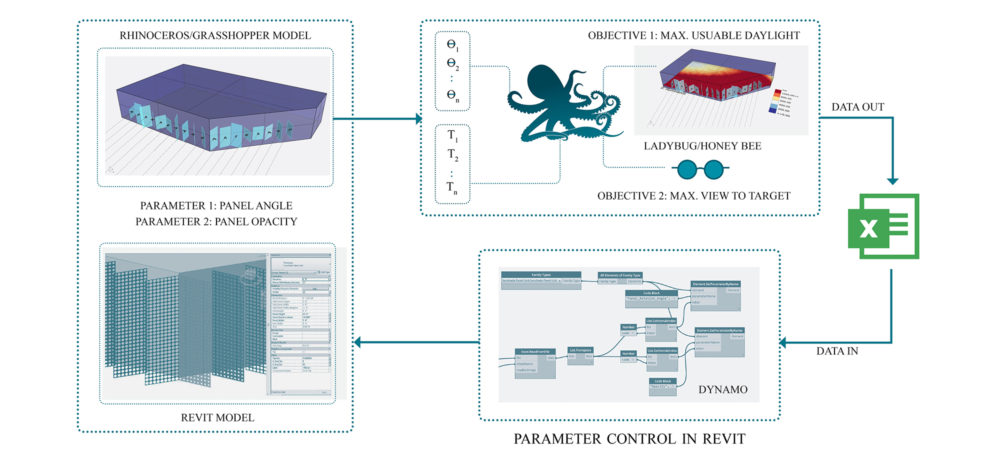
A research paper by Youngjin Lee, AIA, LEED® AP and Bomin Kim, AIA CPHC, has been published in an international blind peer-review journal, Advances in Computational Design. The paper, “Genetic Algorithms for Balancing Multiple Variables in Design Practice,” examines computational practices that allow designers to consider multiple variables at once
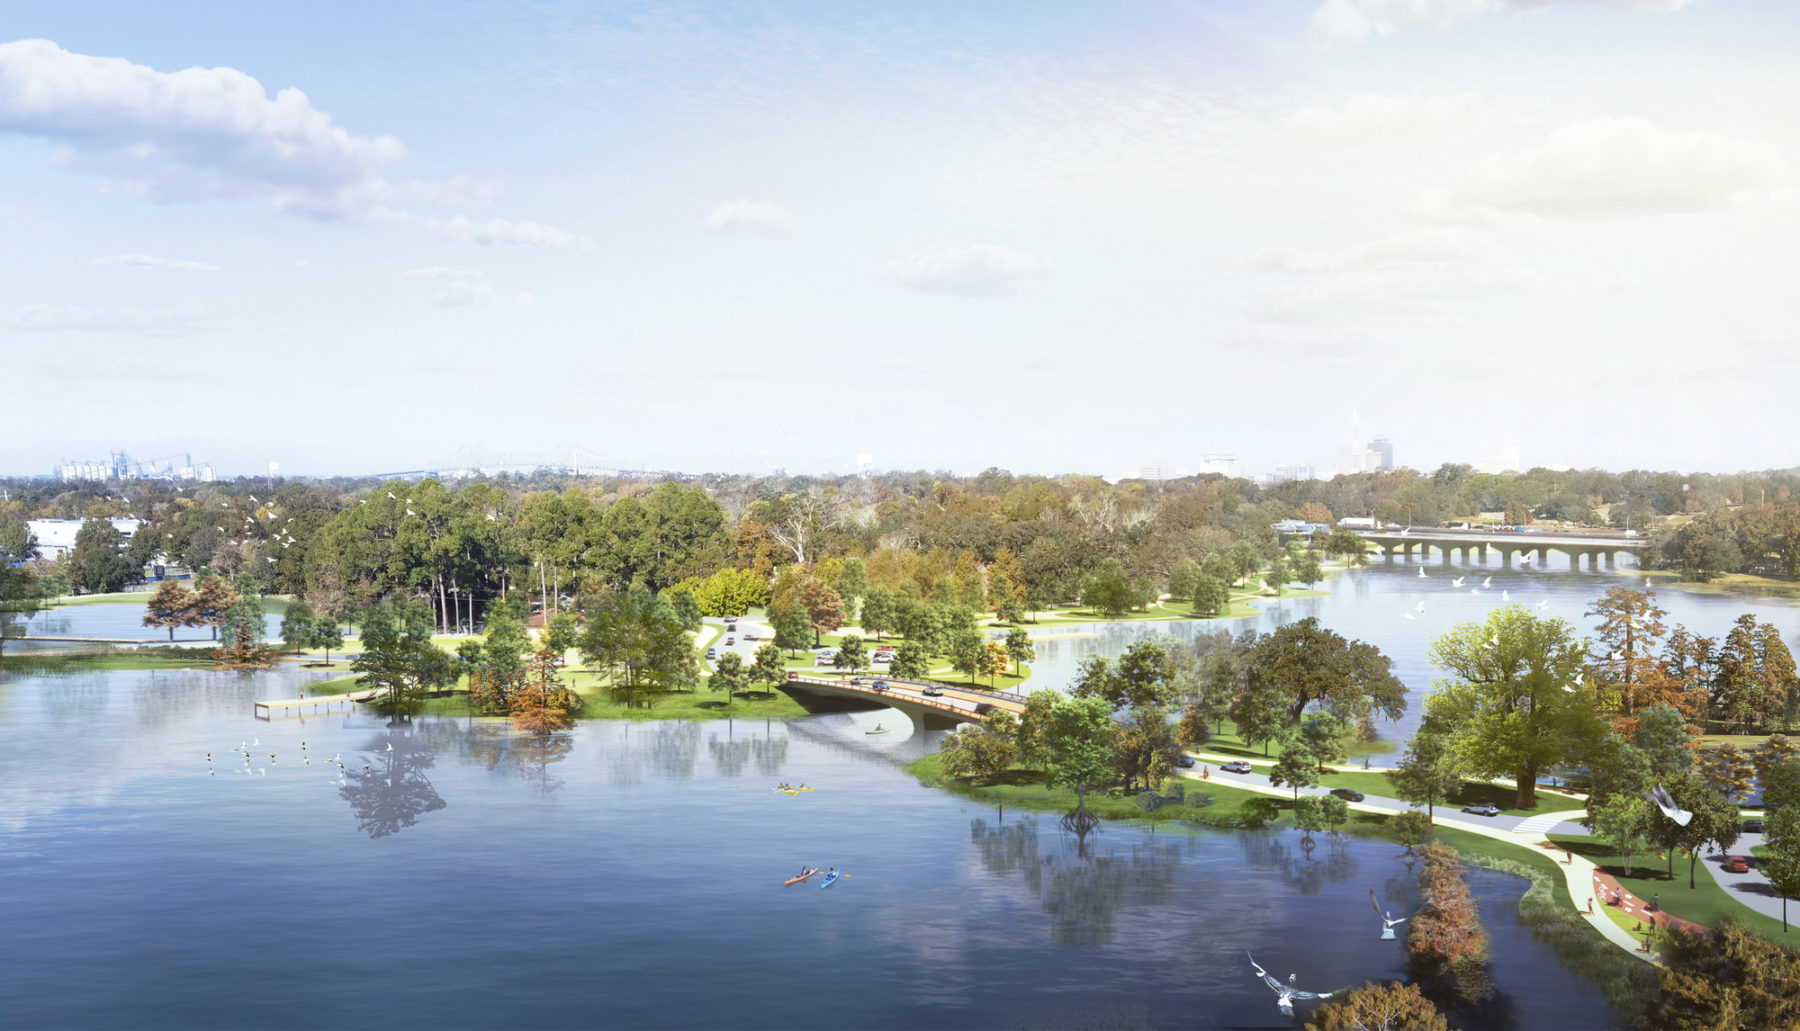
The premiere public amenity of Baton Rouge, LA, long deprived of social, economic, and natural activity, is being revitalized into an ecologically sound, cultural inclusive, and safe place
Corporate leaders need real-time input to make key decisions around workplace space needs. Nimble data dashboards are helping them scenario plan.
A discussion with the Urban Land Institute about weaving data, virtual reality, and analytical tools into all stages of design and development.
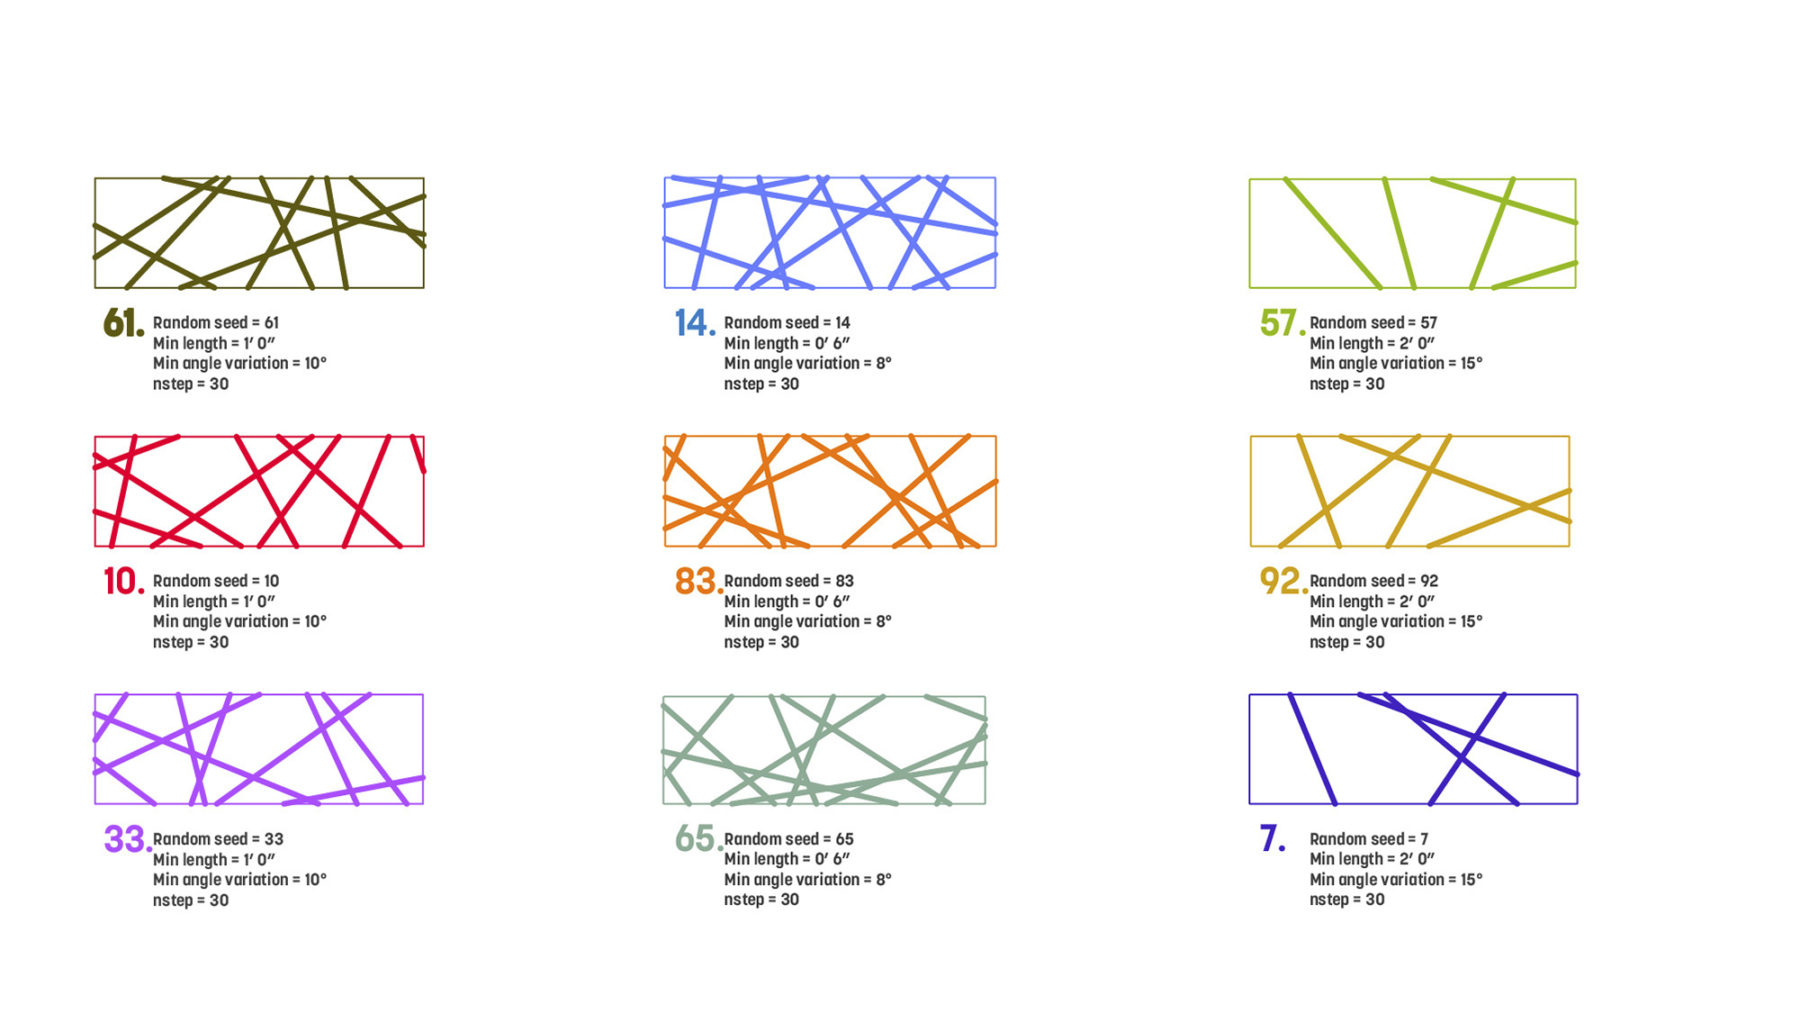
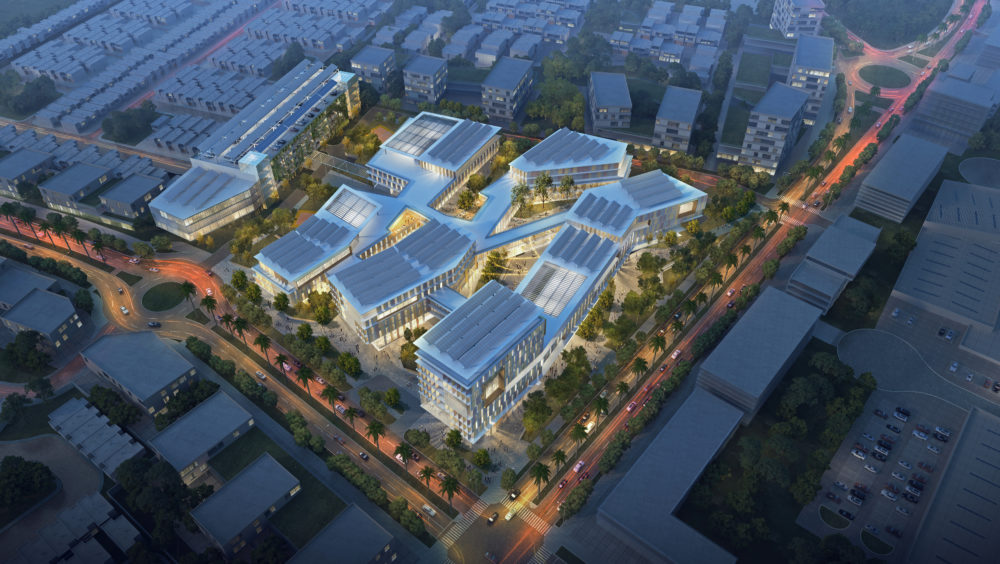
Parametric design saved countless hours and revealed innumerable possibilities for generating the unique line patterns at Akamai Technologies' Kendall Square HQ
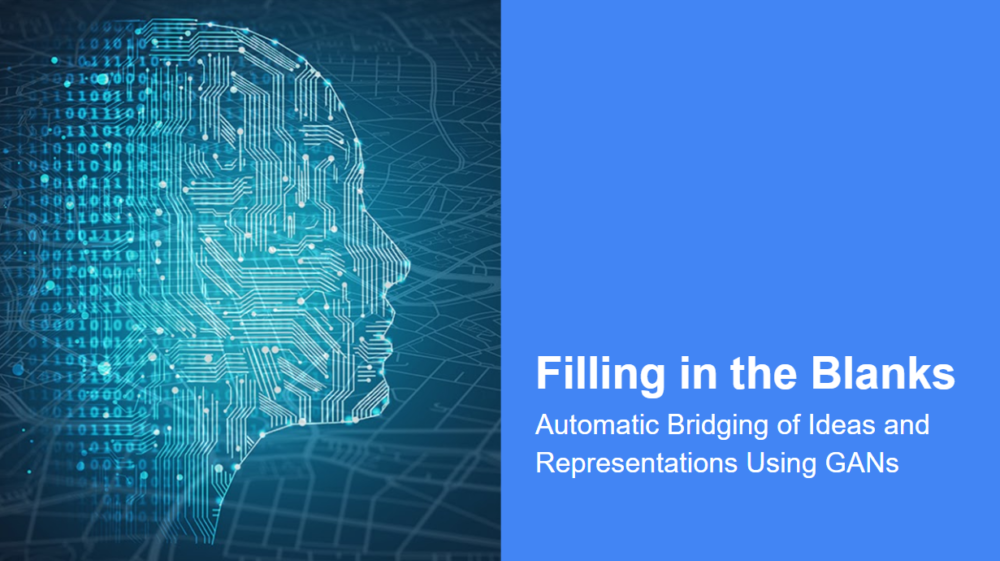
Ken Goulding, Raj Adi Raman, and Scott Penman, discuss machine learning’s impact on architecture and design
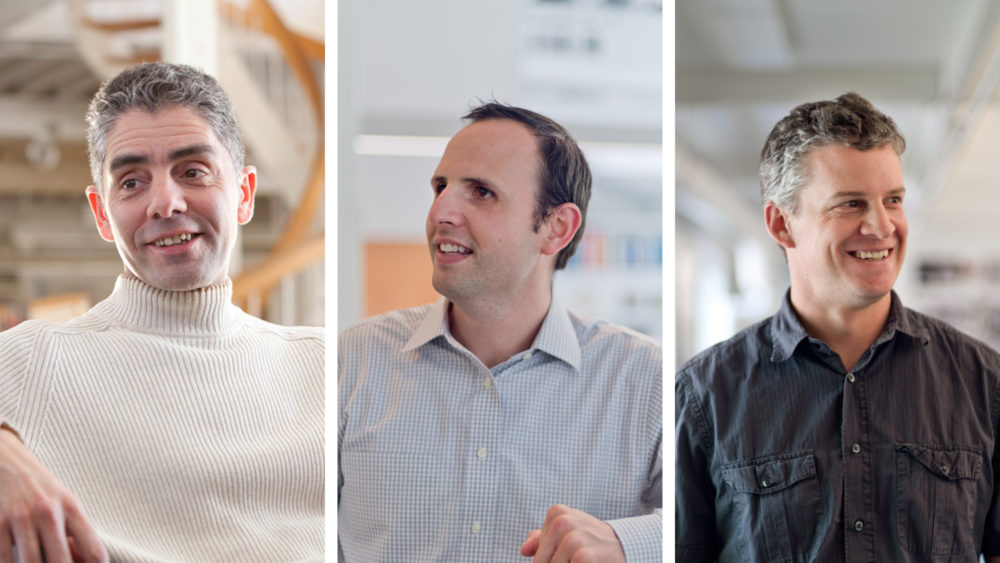
An interview with Sasaki principals Vinicius Gorgati, AIA, LEED® AP, Tyler Patrick, AICP, and Ken Goulding
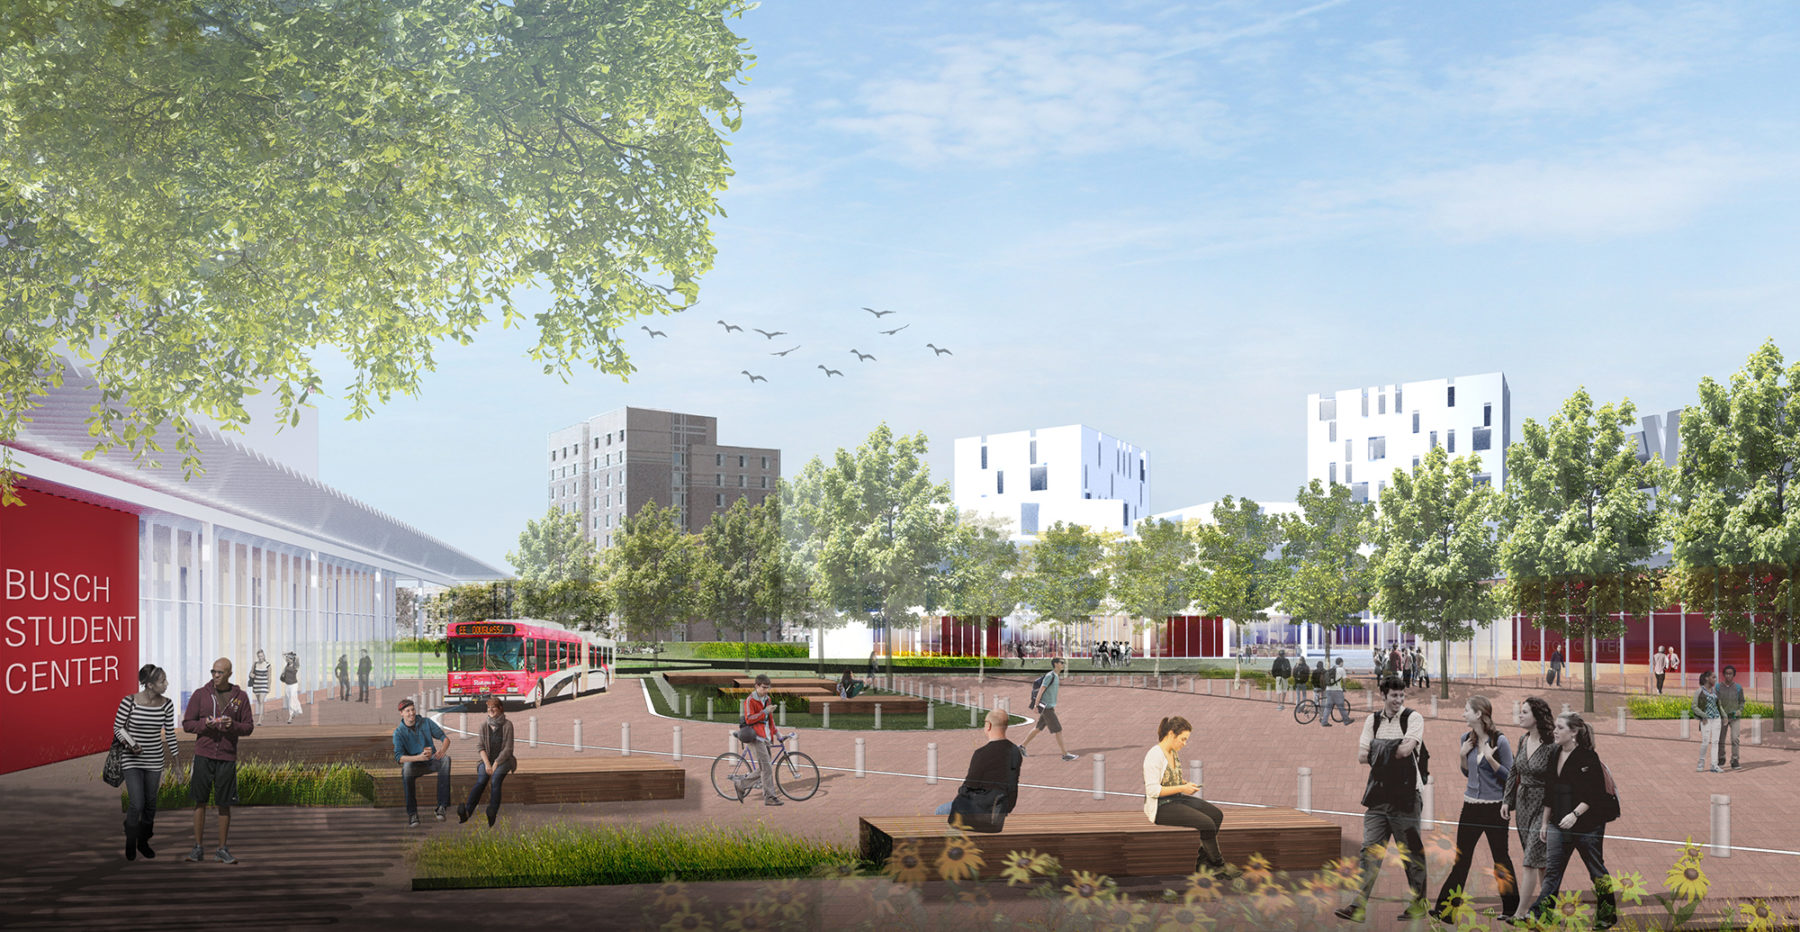
Detailing the story of our discovery process and how we arrived at the recommendations for Rutgers 2030
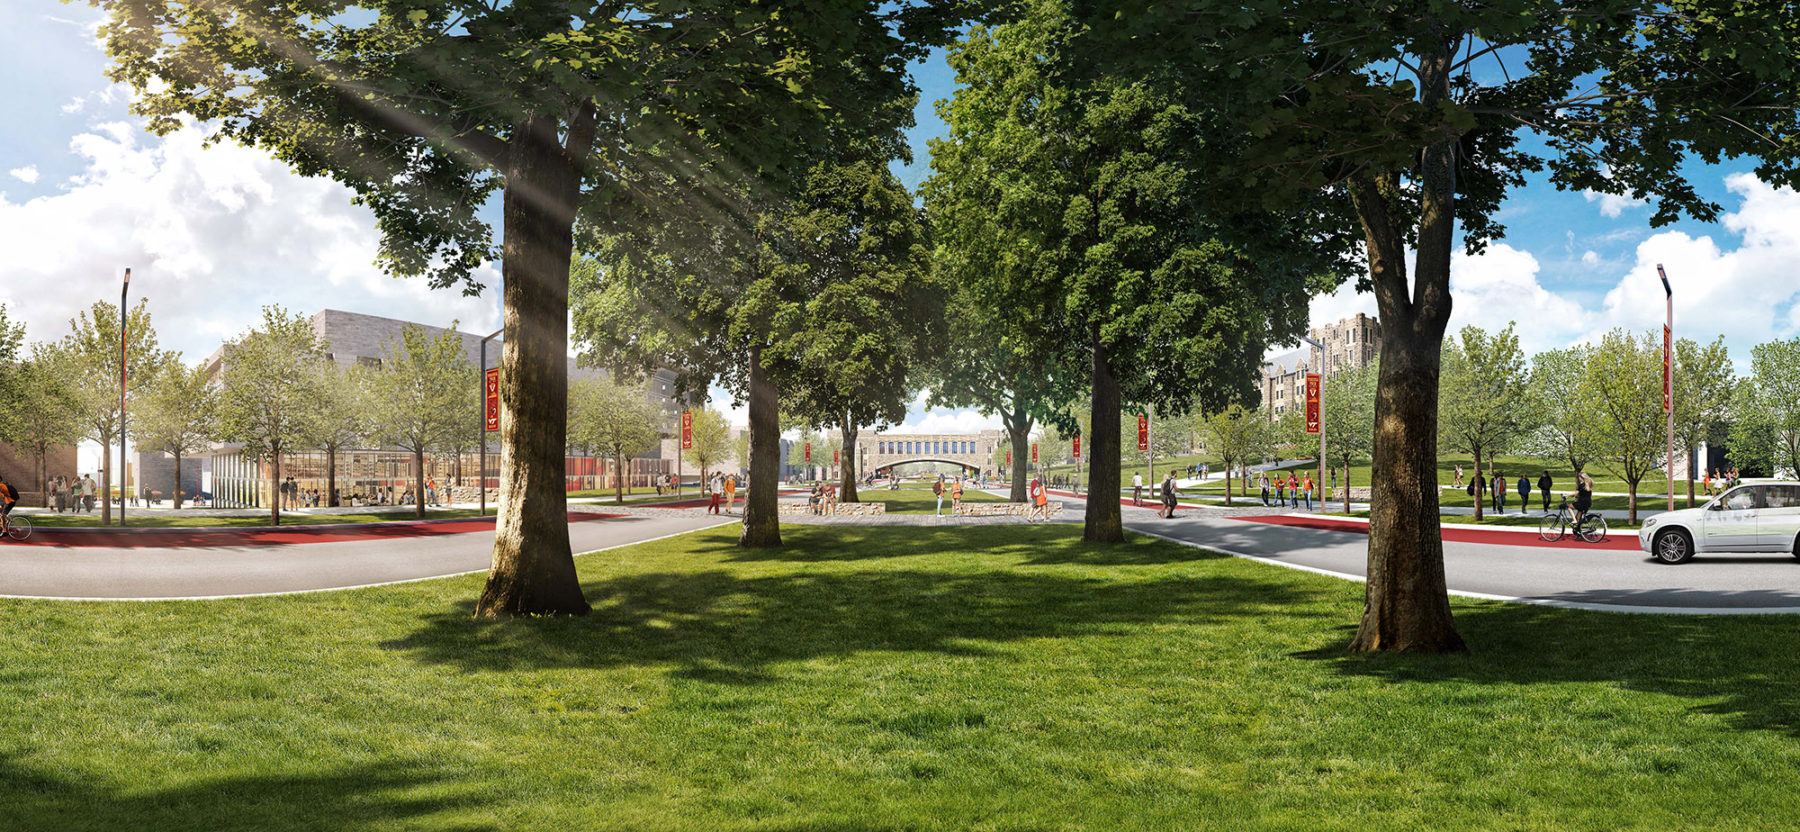
Sasaki delivers a full, 360-degree campus master plan experience via a hyper-customized presentation approach
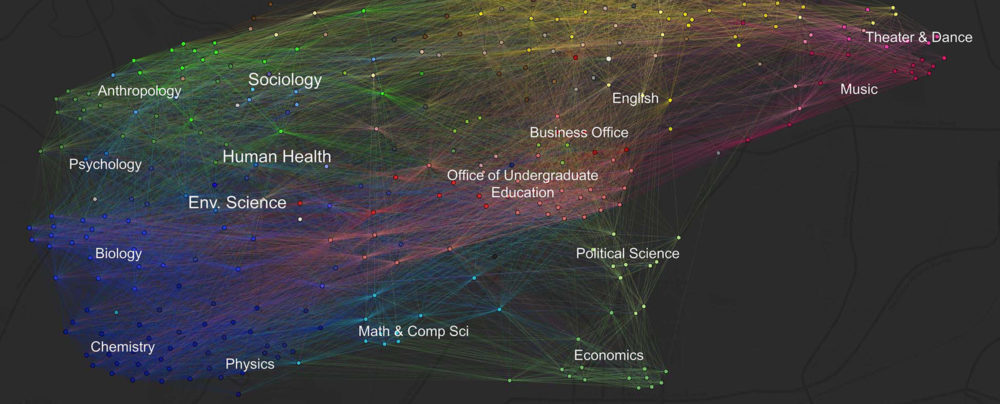
Tyler Patrick discusses space planning at Emory University at the annual meeting of the Society for College and University Planning (SCUP)
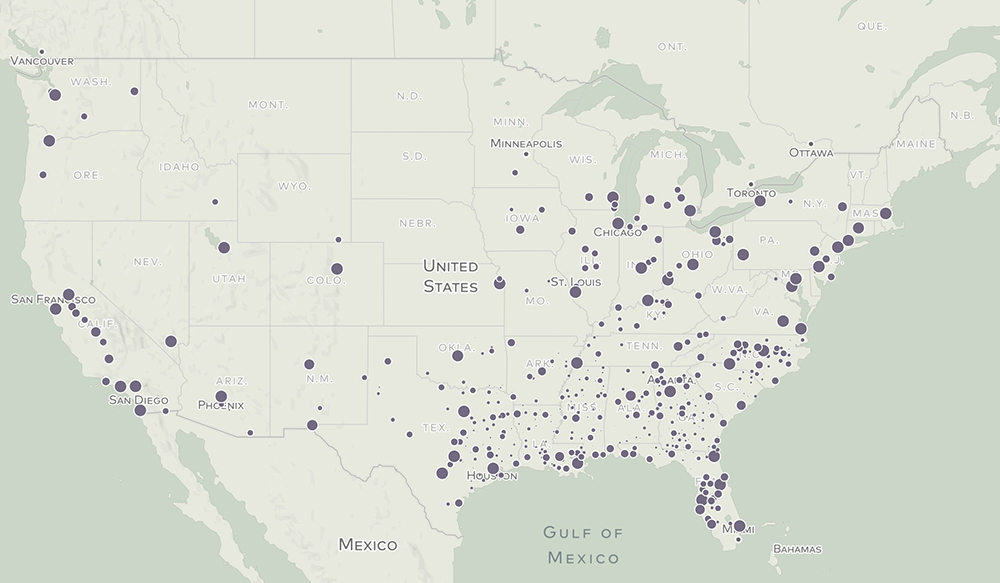
An exploratory visualization of corridors throughout the United States named after the late civil rights leader, this research project looks at data on how the neighborhoods surrounding MLK corridors compare to the larger metropolitan region, across dimensions of race, income and education, and urban development